10 API Gateway Metrics That Matter in Production

April 3, 2025
An API gateway sits on a critical request path, but a large dashboard does not automatically make that path observable. Teams need a compact set of signals that answers three questions: Are users getting successful responses? Where is time or capacity being consumed? Is the telemetry trustworthy enough to support a decision?
The right values depend on the API. A human-facing checkout, an internal batch endpoint, and a streaming API should not share one arbitrary latency or CPU threshold. Start with user-facing service-level indicators (SLIs), establish a baseline, and then connect those indicators to gateway and upstream diagnostics.
This guide explains 10 production API gateway metrics, how to interpret them, and which common alerting shortcuts to avoid.
Key Takeaways
- Measure user-visible outcomes first: request volume, success or failure, and latency distributions.
- Separate gateway processing from upstream behavior so responders know which layer to investigate.
- Use percentiles rather than averages for tail latency, and aggregate histogram buckets rather than averaging precomputed percentiles.
- Treat CPU, memory, connections, and worker capacity as saturation evidence, not universal alert thresholds.
- Monitor rejected traffic, retries, authentication failures, and telemetry health alongside successful requests.
- Control metric labels. Raw paths, user IDs, tokens, and request IDs create high cardinality and may expose sensitive data.
flowchart LR
    Client[API client] --> Gateway[API gateway]
    Gateway --> Upstream[Upstream service]
    Gateway --> Metrics[Metrics]
    Gateway --> Logs[Structured logs]
    Gateway --> Traces[Distributed traces]
    Upstream --> Metrics
    Upstream --> Traces
    Metrics --> Dashboard[Dashboards and SLOs]
    Metrics --> Alerts[Alerts]
    Logs --> Investigation[Incident investigation]
    Traces --> Investigation
1. Request Volume and Traffic Composition
Request rate is the number of requests observed per unit of time. It provides the denominator for most other API metrics and gives capacity signals context. Track both accepted and rejected requests, then break the totals down by dimensions that have operational meaning:
- normalized route or operation;
- HTTP method;
- response class;
- consumer tier, when the label set is bounded and non-sensitive;
- gateway instance, cluster, and region;
- protocol, such as HTTP, gRPC, or WebSocket.
Do not use a raw URI path as a metric label. A path such as /orders/984723 can create a new time series for every order. The OpenTelemetry HTTP semantic conventions require http.route to use a low-cardinality route template, such as /orders/{order_id}. Apply the same principle to Prometheus labels.
Volume alone is not an incident. A campaign may legitimately double traffic, while a quiet period can be evidence of a broken client, DNS problem, or deployment regression. Compare current traffic with a relevant baseline and correlate it with errors, latency, and saturation.
2. Successful, Failed, and Rejected Outcomes
An overall error percentage hides important distinctions. At minimum, separate:
- client outcomes such as
400,401,403,404, and429; - gateway-generated failures, including route misses, policy rejection, timeout, and unavailable upstream errors;
- upstream
5xxresponses passed through by the gateway; - transport failures where no valid HTTP response was produced.
Not every 4xx is a gateway problem. A 404 may be expected for a missing resource; a rise in 401 could be an expired client credential rollout; and 429 may mean that a protective quota is working. Define success from the user journey and API contract, not only from status-class arithmetic.
The Google SRE guidance on service-level objectives recommends selecting SLIs that reflect user behavior. For a synchronous API, a useful availability SLI might be the proportion of eligible requests that receive an acceptable response within a target time. Document which requests are eligible and which response codes count as successful.
3. End-to-End and Upstream Latency Distributions
Monitor latency as a distribution, not only as an average. The mean can look healthy while a small but important share of requests is very slow. Common views include median, p90, p95, and p99, but the percentile and target should come from the user experience and service objective.
Keep at least two measurements:
- Gateway-observed duration: the time from the gateway receiving a request until it finishes the response.
- Upstream duration: the portion spent establishing an upstream connection, waiting for the upstream, or receiving its response, depending on what the gateway exposes.
The difference helps locate added time in gateway processing, queueing, network transfer, or an upstream dependency. Break latency down by normalized route and response outcome; otherwise a fast health-check endpoint can hide a slow checkout route.
For Prometheus, prefer histograms when latency must be aggregated across instances. The Prometheus histogram documentation explains why histogram buckets can be combined and why averaging quantiles from summaries is statistically invalid. Choose buckets around meaningful SLO boundaries and validate them against observed traffic.
4. Upstream Availability and Connectivity
A gateway can be healthy while the services behind it are not. Track upstream signals such as:
- healthy and unhealthy targets reported by active or passive health checks;
- connection and TLS handshake failures;
- DNS discovery or service-registry errors;
- upstream resets and prematurely closed connections;
- time to connect versus time to first byte;
- failures by upstream service and target.
Use bounded target identifiers and avoid ephemeral labels that create uncontrolled time series. An alert should distinguish a single unhealthy replica from loss of the last healthy target. The appropriate response is different: one may require routine replacement, while the other is a user-facing availability incident.
Health checks are supporting evidence, not a substitute for traffic-based SLIs. A target can pass a shallow probe while its business dependency is failing, or fail a probe even though existing traffic is being served by other targets.
5. Gateway Saturation and Runtime Resources
CPU, memory, open connections, event-loop or worker utilization, file descriptors, network throughput, and queue depth describe how close the gateway is to a limit. They are diagnostic and capacity-planning signals.
There is no universal rule that CPU above 80 percent, connections above 80 percent, or any fixed memory value is automatically critical. A gateway may operate safely at sustained high CPU, while latency can degrade earlier because of connection limits, garbage collection, downstream backpressure, or an overloaded network path.
Define saturation alerts from measured behavior:
- load-test the same deployment shape and policy set used in production;
- identify which resource becomes limiting;
- correlate the resource with latency and errors;
- leave headroom for instance loss and traffic bursts;
- verify that autoscaling uses a signal that leads demand rather than reacts after SLO failure.
When scaling horizontally, include per-instance and fleet-level views. An even fleet average can hide one hot instance caused by uneven connection distribution or a skewed route.
6. Timeouts, Retries, and Circuit-Breaker Events
Timeouts and retries are essential failure signals. Track them by route, upstream, reason, and attempt number where the cardinality remains bounded. A retry can hide an upstream failure from the final status code while increasing load and latency.
Measure:
- upstream connect, send, and read timeouts separately;
- requests that required at least one retry;
- attempts per original request;
- final outcomes after retries;
- circuit-open or ejection events, when the gateway or surrounding system implements them.
Retries must be bounded and limited to operations that are safe to repeat. A failed POST may have completed upstream even if the gateway did not receive the response. Use idempotency keys or an application-specific deduplication design before retrying state-changing operations. Alert on retry amplification—the ratio of upstream attempts to original client requests—because it can turn a partial failure into overload.
7. Rate-Limit and Quota Rejections
Count rate-limit decisions separately from other 429 responses when possible. Useful dimensions include normalized route, bounded consumer tier, policy, and rejection reason. Avoid putting API keys or user identifiers in labels.
Interpretation requires policy context. A rise in rejections may indicate malicious automation, a client bug, a successful launch, or a limit that no longer matches the product contract. Pair rejection counts with:
- allowed request volume;
- unique affected consumers from privacy-reviewed logs, not unbounded metric labels;
- remaining quota distribution when the product exposes it safely;
- upstream saturation and latency;
- changes to route or consumer policy.
An alert based only on the absolute number of 429 responses can page during expected protective behavior. Prefer a ratio plus a minimum traffic condition, or alert when important consumers are unexpectedly blocked.
8. Cache Effectiveness and Correctness
For routes where the gateway caches responses, record cache hits, misses, bypasses, expirations, and revalidation or stale responses if supported. The basic hit ratio is:
cache hits / cache-eligible requests
The denominator matters. Authentication-dependent or personalized responses may be intentionally ineligible. There is no universal target such as a 60 percent hit rate; some APIs should not be cached at all.
Monitor correctness alongside efficiency. A high hit ratio is harmful if cache keys omit a header or identity dimension that changes the representation. Review Cache-Control, Vary, authorization behavior, purge events, and response size. Compare upstream request reduction and latency improvement with the cost and staleness risk of the cache.
9. Authentication and Security-Policy Signals
Gateways can expose useful security signals, including failed authentication, invalid or expired tokens, authorization denial, blocked IP rules, rejected request sizes, malformed requests, and WAF or bot-policy actions. These events indicate what the gateway observed; they do not prove an attack or replace application authorization checks.
Separate expected denials from anomalies. For example, expired tokens may be routine, while a sharp increase across many accounts from one network may require investigation. Use logs or a security analytics system for high-cardinality investigation details and keep metric labels bounded.
Never include credentials, raw authorization headers, session cookies, token contents, or sensitive payload data in metrics or logs. Restrict access to the telemetry endpoint and storage. The application must still enforce object-level and business authorization, because a gateway usually cannot decide whether a user may access a specific order or account record.
10. Telemetry Pipeline Health and Cost
Monitoring can fail silently. Track the health of exporters, collectors, scrape targets, and storage so responders know whether “no errors” means healthy traffic or missing data. Useful signals include:
- scrape success and scrape duration;
- dropped samples, spans, or log records;
- exporter queue depth and send failures;
- collector CPU and memory saturation;
- ingestion delay and dashboard freshness;
- active time-series count and cardinality growth;
- tracing sample rate and tail-sampling decisions.
Telemetry overhead also belongs in capacity tests. Excessive labels, full-fidelity logs, or 100 percent tracing can increase cost and affect the system being observed. Set retention, sampling, and redaction rules deliberately, then alert when the pipeline violates them.
flowchart TD
    SLI[User-facing SLI breach] --> Outcome{Which outcome changed?}
    Outcome -->|Latency| Latency[Compare gateway and upstream duration]
    Outcome -->|Errors| Errors[Separate gateway, policy, transport, and upstream failures]
    Outcome -->|No traffic| Intake[Check DNS, routing, clients, and telemetry freshness]
    Latency --> Saturation[Check gateway and upstream saturation]
    Latency --> Retry[Check timeouts and retry amplification]
    Errors --> Health[Check target health and connectivity]
    Errors --> Policy[Check auth, quota, and deployment changes]
    Intake --> Pipeline[Verify scrape and export health]
Building an Actionable Dashboard
Start with a service overview rather than 10 unrelated panels. Put request volume, the user-facing success SLI, latency distribution, and current SLO error-budget consumption together. From there, link to drill-down views for upstream health, saturation, retries, policy decisions, and telemetry health.
Use consistent filters for cluster, region, environment, normalized route, and deployment version. Annotate releases and policy changes. A comparison against the same weekday or a rolling baseline is usually more useful than a fixed threshold copied from another service.
Alerts should describe a user-impacting condition and provide enough context to begin triage. Multi-window, multi-burn-rate SLO alerts are often more useful than paging on every short spike. Resource and component alerts can remain tickets or warnings unless they predict an imminent SLO failure.
Monitoring Apache APISIX with Prometheus
Apache APISIX provides a Prometheus plugin and metrics endpoint. The official documentation describes enabling the plugin and retrieving metrics from the dedicated export endpoint. In the documented local configuration, you can verify the endpoint with:
curl --fail --silent http://127.0.0.1:9091/apisix/prometheus/metrics
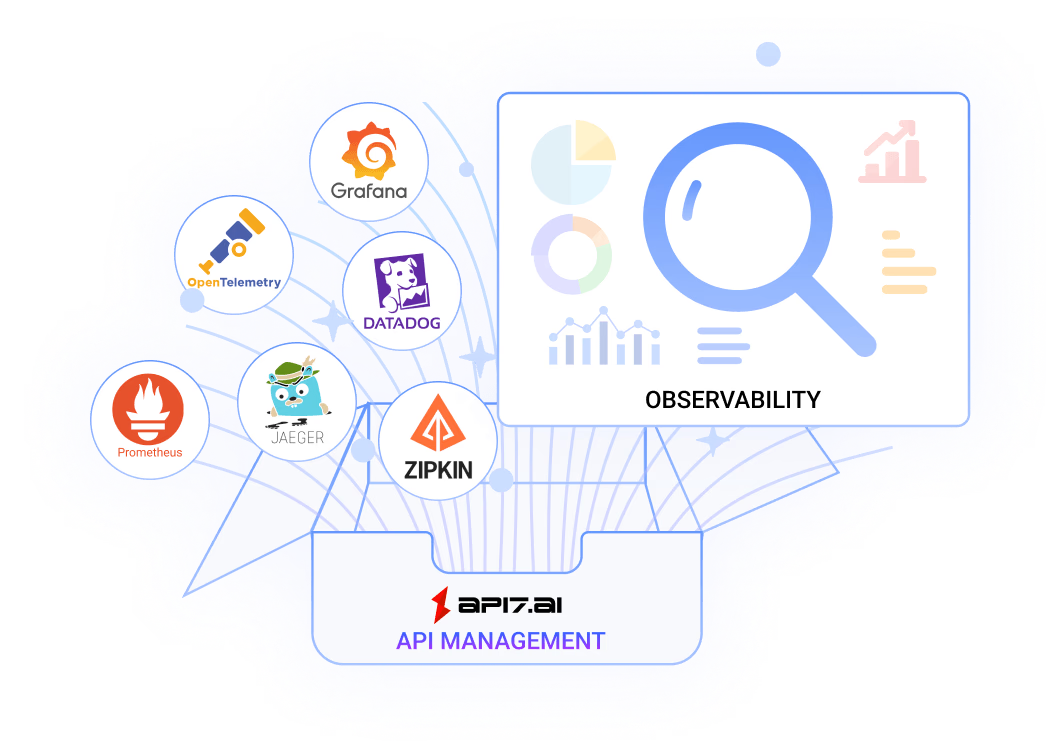
Keep the metrics endpoint on a protected management network or enforce equivalent access control. Scrape it with Prometheus, then use Grafana or another visualization layer for dashboards. Verify the metric names and labels against the APISIX version you run before importing alert rules; observability schemas can evolve.
APISIX metrics should be combined with upstream service metrics and distributed traces. A gateway can report that an upstream request was slow, but an application trace is often needed to identify which database or downstream call consumed the time. A broader microservices monitoring guide can help connect those signals across the request path.
A Practical Rollout Checklist
- Define the user journey and an availability and latency SLI for each critical API class.
- Inventory the gateway metrics, logs, and traces available in the deployed version.
- Normalize route labels and remove secrets, IDs, raw paths, and other high-cardinality values.
- Separate gateway-generated, policy-generated, transport, and upstream outcomes.
- Configure latency histograms around meaningful objectives and validate aggregation.
- Add upstream health, saturation, timeout, retry, quota, cache, and security views.
- Monitor the monitoring pipeline itself.
- Load-test alert assumptions and document response actions in runbooks.
- Review dashboards after real incidents and remove panels that do not support decisions.
- Revisit SLOs and capacity baselines as traffic and product behavior change.
Conclusion
The most useful API gateway monitoring program is not the one with the most metrics. It is the one that connects user-visible outcomes to a small number of diagnostic signals and makes missing telemetry obvious.
Track volume, outcomes, latency, upstream health, saturation, timeouts and retries, policy rejections, cache behavior, security signals, and telemetry health. Set targets from API contracts and measured behavior instead of universal thresholds. With that structure, a gateway dashboard becomes an incident and capacity-management tool rather than a collection of graphs.